Is US Oil About to Crash or Bounce? A Simple Guide to the $63 Level
US oil is testing the critical $63 support level, a zone that could determine whether prices bounce toward recovery or break down into deeper correction. Traders are closely watching volume and macro signals to confirm the next major move.

Key Levels to Watch The Traffic Lights
To understand where the price is going, we need to look at these three main areas on the chart:
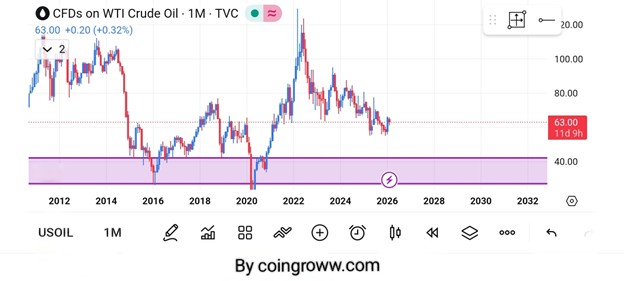
The Support Zone ($35 - $45): Look at the purple box at the bottom. This is the Safety Net. In 2016 and 2020, every time the price touched this area, it jumped back up quickly.
The Current Price ($63): We are currently sitting in the middle. This is a Wait and See zone.
The Resistance $80 - $100): This is the Ceiling. Until oil breaks above $80, the trend remains weak.
Price Prediction: What Happens Next?
Based on the chart patterns, here are the two most likely scenarios for 2026:
Scenario A: The Slow Slide Bearish
If the global economy slows down oil could drift lower toward that purple support zone ($40 - $45). This would be a massive Buy area for long-term investors because historically oil doesn't stay that cheap for long.
Scenario B: The Quick Recovery Bullish If there is a sudden jump in demand, the price might bounce from $60 and head straight back to $80. If it breaks $80, we could see $100 again very soon.
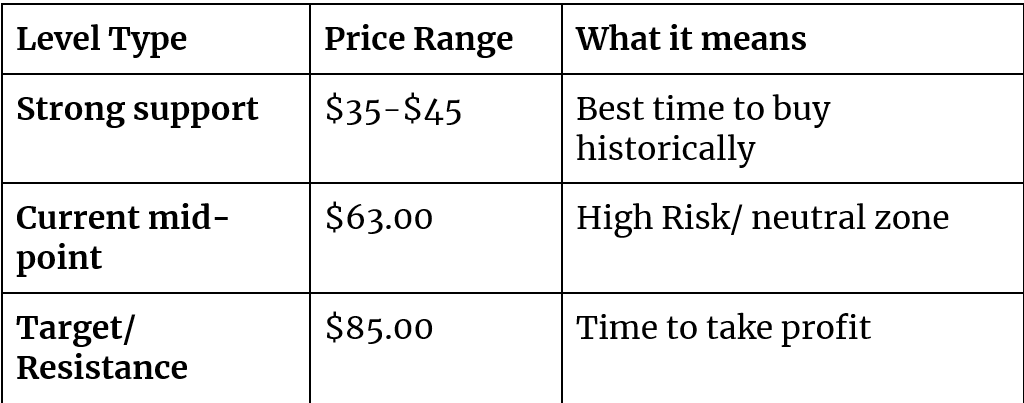
Summary Table for Quick Reference
Final Thoughts for Traders
Don't rush into a trade at $63. The smart move is to wait. Either wait for a clear bounce toward $80 or be patient and wait for the price to hit the Purple Discount Zone near $45.
Disclaimer: This is for educational purposes only. Always do your own research before investing your money!